


 RSS
RSS|
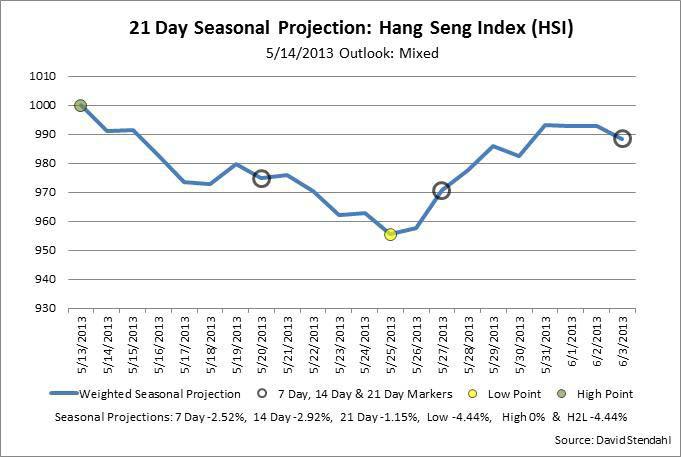
David Stendahl is a consultant to managed futures CTAs and author of several books and videos, including Profit Strategies: Unlocking Trading Performance with Money Management and Dynamic Trading Indicators (Marketplace Books).� Mr. Stendhal builds trading algorithms for various quantitative investment firms. In a recent research note Mr. Stendhal noted that Hang Seng Index (HSI) looks to have a short-term seasonal bearish bias with good down side potential.� He basis this off his seasonal projection weighting of four historic seasonal averages for Hang Seng Index. Specifically, he combined the 5/10/15/20 yearly averages to form a single seasonal line (Chart Below). This seasonal weighted line (shown in blue) is then projected forward 21 calendar days from the outlook run date. Grey circles provide perspective for potential 7/14/21 day return projections. Low and high points over the 21-day period are highlighted in yellow and green respectfully, pointing out potential returns. The final return figure listed on the chart relates the Low to High (L2H) point or High to Low (H2L) point depending upon the Low/High historic order. Each of these return figures are posted at the bottom of the chart and should be used strictly for reference purposes only, as the Seasonal Projection chart is not to be used for buy/sell recommendations. The true use for the Seasonal Projection chart is as a position sizing tool -- indicating when to trade more or less aggressively. If the seasonal projection is bullish or bearish, and this outlook corresponds with your trading system, you might consider trading more aggressively. If however, your system conflicts with the seasonal outlook, you might consider trading more conservatively. The market outlook, shown towards the top of the chart, reflects various return data points compiled into a seasonal projection. Respect the seasonal trends, is his message.� The best time to use Seasonal Projection charts is when the current Hang Seng Index contract is highly correlated to its 5/10/15/20 yearly seasonal charts. Seasonal Projection:
|

|
This article was published in Opalesque Futures Intelligence.
 

|


