


 RSS
RSS|
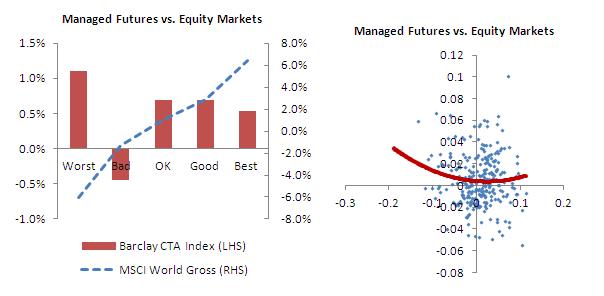
Decoupling "Convex" Relationships with Volatility Cycles By Kathryn M. Kaminski, PhD. Recap: 2011 was a period fraught with turbulence in financial markets. Managed Futures strategies, despite their common association with long volatility, did not fare as well as some might have expected amidst this turbulence. A closer look at volatility, what it means to be long or short volatility, and Managed Futures performance across different regimes in volatility can provide insights into the strategy's complex or "convex" relationship with volatility. A closer look at the cycles of volatility demonstrates that Managed Futures is able to capture "crisis alpha" for investors over negative volatility cycles while in certain turbulent periods they also face some of the same "short volatility" risks that plague many hedge fund strategies. What is Managed Futures? Where does the "long volatility" or "convex" classification come from? The most important characteristic that Fung and Hsieh brought to attention was the "convex" option-like relationship between trend following and equity markets. To demonstrate this simply, equity market returns can be divided into 5 bins. These bins range from the worst equity months (or bottom 20% of returns for equity) to the best equity months (top 20% of returns for equity). When equity market returns are divided up and compared with the performance of Managed Futures it results in a convex function(A convex function is a curve that holds water – a bowl like shape). Figure 4 plots the conditional performance of Managed Futures versus equities in both conditional on performance of equities under 5 subgroups and a scatter plot. The bar graph on the left of Figure 4 shows positive performance for the worst months in equities and good performance during good periods in equity markets suggesting a convex relationship. It is important to remember that a convex relationship implies that the strategy has good performance in both tails of equity markets – both positive and negative extreme events. Given equities inverse relationship with long volatility, a natural extension which is often made is that Managed Futures is "long volatility".
Figure 4: Managed Futures (Barclay CTA Index) vs. Equity Markets (MSCI World Gross) Bar Chart and Scatterplot. Source: Pertrac and HFR Despite being classified as "long volatility": Managed Futures is both "long volatility" and "short volatility"
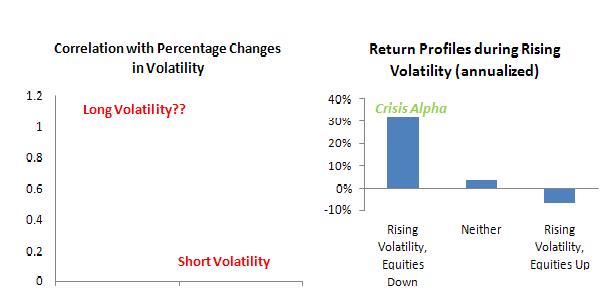
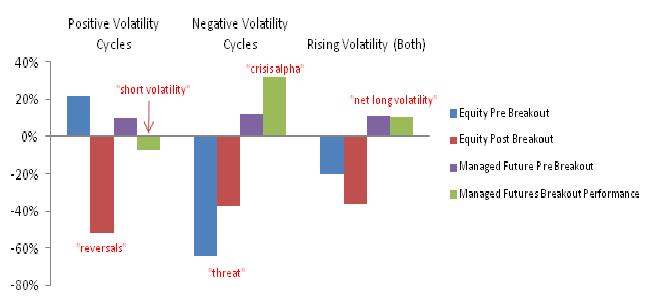
Figure 5: Correlations with Changes in Volatility: Managed Futures (Barclay CTA Index) and MSCI World Gross. Source: Pertrac and HFR A closer look at times where a "breakout"2 in volatility occurs can help clarify the origins of Managed Futures' performance during periods of rising volatility. These breakouts can be classified as being initiated by positive events (similar to a "run-up" of positive volatility cycles) or negative events (similar to a "threat" of negative volatility cycles). Given the period of January 1990 until January 2012, there are 265 months during this period and there are 51 months (or 19.2%) which qualify as a rising volatility breakout movement upwards 23 of these are precipitated by positive equity returns and 28 are by negative equity returns. In Figure 6, the annualized performance of Managed Futures during rising volatility following negative events is very large and positive whereas Managed Futures performance rising volatility following positive events is negative. Figure 7 plots the performance of both equities and Managed Futures during positive volatility cycles, negative volatility cycles and both combined. A closer look at Figure 7suggests that Managed Futures may deliver "crisis alpha" during the "threat" or crisis phase of a negative volatility cycle while they seem to suffer during the reversals associated with positive volatility cycles (which sometimes may also be the beginning of a crisis event).3 This simple decoupling of volatility demonstrates that Managed Futures is "long volatility" collecting "crisis alpha" over negative volatility cycles and "short volatility" during positive volatility cycles where quick reversals hurt the strategy. Since the overall relative size of "crisis alpha" for managed futures is substantial, the strategy "on average" is net "long volatility."
Figure 7: Conditional Performance pre and post Breakout for Equity (MSCI World Gross) and Managed Futures (Barlcay CTA Index) Source: Pertrac and HFR Equity Market Crisis, Negative Volatility Cycles, and Managed Futures Market crisis is then followed by periods of uncertainty (or high volatility), the hidden risks have come out there are no new serious risks plaguing investors but investors change their risk appetite based on their previous negative experiences. A managed futures strategy will have difficulty finding real trends in an uncertain market environment. The selective advantage the strategy has during crisis will no longer be valid since other investors will also be less exposed to credit and liquidity. In fact, when equity markets surge back Managed futures strategies may or may not be able to catch trends since the positive trends tend to revert much quicker (similar to the shorter positive volatility cycles). A Closer Look at Managed Futures Performance and Volatility Post Credit Crisis
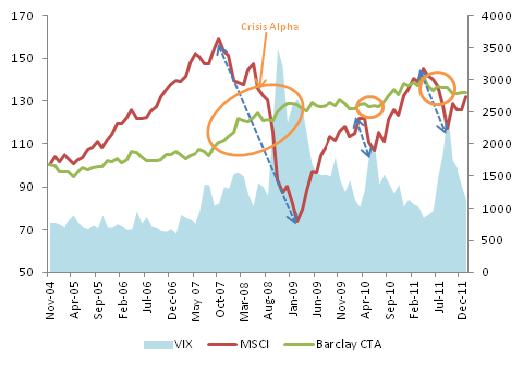
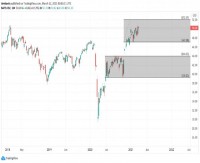
Figure 7: Past Performance of Managed Futures (Barclay CTA Index), MSCI World Gross, and the VIX Source: Pertrac and HFR The inability of the strategy to deliver crisis alpha during these times could be attributed to the following points. First, risk preferences may still residually reflect 2007-2008. Second, most investors are not holding as many hidden risks as they might have prior to 2007-2008 decreasing the strategy's competitive advantage. Third, the subsequent drawdowns in equity markets in 2010 and 2011 pale in comparison to the drawdowns experienced during 2007-2008 limiting the quantity of crisis alpha to be captured. These events, in the long run, pale in comparison to the bear markets of 2007-2008. Fourth, each of the two subsequent drawdown periods where initiated by a positive volatility cycle with quick reversals which are on average difficult for Managed Futures strategies which may hold a "short volatility" bias based on their use of leverage. The role of hidden risks, common in hedge fund strategies, can also help explain why Managed Futures had such an advantage in 2007-2008 as opposed to Spring 2010 and Summer/Fall 2011. These risks in Managed Futures strategies as well as their prevalence during the past three crisis periods are detailed below in Table 1.
Table 1: Examining Hidden Risks in Managed Futures Strategies and their Prevalence in Past Crisis Events Conclusions Investors who may have labeled Managed Futures as long volatility may have been disappointed in Spring of 2010 and Summer/ Fall 2011. Managed Futures is a strategy which makes money during breakdowns in market efficiency, these breakdowns usually are the most pronounced during financial crisis or periods of "threat". As a result, managed futures ability to capture these inefficiencies will be directly related to the level of inefficiency which occurs during crisis and the negative volatility cycle that follows crisis. A Managed Futures strategy is reliant on the calm before the storm or on markets going back to a state of normalcy where investors become comfortable in risk taking again. This allows investors to forget about past losses and pile on new hidden risks unknowingly leaving them unprepared for the next financial storm that may lay ahead. BIOGRAPHY : Kathryn M. Kaminski, PhD, is the CIO and Founder of Alpha K Capital LLC, a thematic fund of hedge funds focused on "pro-active strategies" for tail risk management. Prior to starting Alpha K Capital, Kathryn worked in investment management as a Senior Investment Analyst at RPM, a fund of hedge funds in Managed Futures. While at RPM, she coined the phrase "crisis alpha" to describe Managed Futures strategies with her work in Futures Magazine and for the CME Education Group as a market commentator. She also has quant experience in both emerging fixed income and credit markets. Kathryn earned her PhD at the MIT Sloan School of Management where she did research on financial heuristics in collaboration with Professor Andrew W. Lo as part of the MIT Laboratory for Financial Engineering. Her research interests are in the area of portfolio management, asset allocation, financial heuristics, behavioral finance, and alternative investments. She holds and has held academic lecturing positions in the areas of derivatives, hedge funds, and financial management at the Stockholm School of Economics, the Swedish Royal Institute of Technology (KTH), and the MIT Sloan School of Management. |

|
This article was published in Opalesque Futures Intelligence.
 

|


