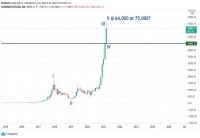
|
A Diversified Portfolio
It does not necessarily take many commodity trading advisors to create a
diversified portfolio. Only five may do the trick, as the example below
suggests. It comes from Tyler Wood of Integrated Capital Solutions-see the
interview with him in the next section. The analysis below is by Chidem Kurdas.
This portfolio is hypothetical in the sense that it supposes a managed account
consisting of these CTAs during the period January 2007 through July 2010. The
advisors and their individual returns are real, but they have not been trading
in one account during the specified period.
Being hypothetical, the composite portfolio benefits from hindsight-it is
designed with the knowledge of the traders' returns. It does not represent
future performance, of course. But it demonstrates the diversity of CTAs, both
from each other and from underlying markets, and thus the potential advantage of
combining them.
Despite stellar performance by commodity trading advisors in 2008, investors did
not immediately rush to managed futures. One reason people are slow to espouse
managed futures is the impression that CTA returns are volatile.
Another reason is some investors' belief that lackluster performance tends to
dominate over time. While 2008 was a great year for managed futures, 2009 was
not good and the sector lost money. That raised fears as to long-term
performance.
Constructing a diversified portfolio of CTAs is a solution to both these issues.
Within managed futures, it is possible to find strategies with very different
risk/return characteristics. Combining uncorrelated trading programs can result
in a portfolio that has less volatility and better overall performance than the
industry as a whole. Thus the Integrated Capital Solutions sample portfolio
described here posted positive returns in 2009 as well as in 2008.
The largest component of the portfolio is a program that trades spreads between
different contract months in the same market. The manager is Van Essen, a name
that has recently been prominent on best-performing CTA lists.
CHART 1
Source: Integrated Capital Solutions
A notable feature of this portfolio is that it contains two option selling
programs (chart 1). Option selling does carry special risks, as evidenced by
sharp drawdowns at times. But option strategies have no or negative correlation
to other managed futures strategies, so they add strong diversification to a
portfolio of CTAs.
Demonstrating this characteristic, some option programs did exceptionally well
in the past year while other strategies struggled, as we pointed out in our
August 17 issue. One of the option programs profiled in that issue, FCI Credit
Premium, is part of the ICS portfolio. It has negative 40% correlation to the
Newedge CTA Index and negative 51% to the S&P 500 (chart 2).
The other option program in the portfolio is from White River. FX trading and
multi-strategy programs round out the ICS portfolio. All the programs have low
or negative correlation not only to the stock market but also to managed futures
as represented by the Newedge CTA Index.
CHART 2 Correlations
--------------------------------------------------------------------------------------------------------------------------------------------------
Program |
Correlation to |
|
|
S&P 500 |
Newedge CTA Index |
Van Essen, Spread Low
Min |
-0.04 |
-0.17 |
HB Capital,
Multi-strategy |
-0.17 |
-0.23 |
Portfolio FX - PFGBEST
MFX |
-0.12 |
0.12 |
White River, Diversified
Option |
0.23 |
0.12 |
FCI Credit Premium |
-0.51 |
-0.04 |
--------------------------------------------------------------------------------------------------------------------------------------------------
Combining these programs results in robust performance through the period (chart
3). Unfortunately, given the well-known limitations of hypothetical performance,
the specific portfolio is not a model for the future. But the basic idea of
combining uncorrelated CTA programs should be valid under varying market
conditions. This exercise can be seen as an informal stress test for the idea.
CHART 3
------------------------------------------------------------------------------------------------------
Year |
Sample
Portfolio Return |
2007 |
10.77% |
2008 |
38.98% |
2009 |
24.09% |
2010 |
5.91% (through July) |
-------------------------------------------------------------------------------------------------------
|