


 RSS
RSS|
Spread Trading Primer Spread trading equity index futures is popular with commodity trading advisors and is increasingly getting investor attention. What are the advantages and disadvantages of this type of strategy? How is it done? Veteran spread trader John Netto explains below. He is president of M3 Capital and the author of articles and a book on trading methods. This discussion is a condensed version of a report he wrote for Eurex, the derivatives exchange. Markets are in a continuous state of change. If traders rest on their laurels, strategies that work for them today may no longer deliver profits tomorrow. In order to stay one step ahead of market developments, successful traders are always looking to improve their methods. Here I describe the issues and necessary steps in developing an effective spread trading strategy. While this paper is limited to equity index futures spreading, the basic concepts of spread trading described here apply to all investment complexes. What is Spread Trading? Conceptually, spread trading involves taking opposite positions (one long, one short) in related markets with the goal of benefiting from the relationship between two (or more) positions. The opposite positions are commonly referred to as legs. While spreads often contain just two legs, they can have multiple legs. Generally, markets that are closely related, or correlated, form the two sides of a spread trade. The correlation between the two sides of a spread trade is not a perfect hedge. This imperfection represents opportunity for traders, as they speculate on whether this relationship converges or diverges over a period. I typically do spread trades on products with a historical correlation of 0.90 or higher. While I have put on less correlated spreads like gold and crude oil, lower correlations can detract from one of the main features of spread trading, namely reduced risk. Low correlation between the two sides of a spread increases the volatility of a trading portfolio. Example Consider two popular and liquid Eurex benchmark products, the Dow Jones EURO
STOXX 50 Index Futures (FESX) and the DAX Futures (FDAX). The FESX is an equity
index futures contract based on a benchmark that tracks the 50 largest companies
in the euro-zone. It excludes companies from Switzerland, the United Kingdom and
several other countries. DAX Futures are based on Deutsche B�rse’s blue chip
index that tracks the 30 largest German companies by market capitalization and
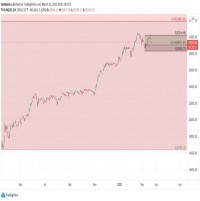
order book volume. The chart below illustrates the relationship between FESX and FDAX contracts. For the time that is reflected in this chart, the higher the overall spread price moves, the more the FESX outperforms the FDAX. As the spread price falls, the more the FESX underperforms the FDAX. CHART 1 Relationship Between Dow Jones EURO STOXX 50 Index and DAX Futures  If a trader is long the spread (long the FESX, short the FDAX), there are two ways that this scenario will produce a profit:
Remember, the spread relationship is what determines profit and loss in a spread trade. The absolute price of the index futures is irrelevant. Risks of Spread Trading Aside from the obvious danger of incorrectly speculating on the direction of the spread, there are other risks. One of the most common is "legging risk". Legging risk means that while putting on one side of the spread, the price of the other side moves away before you can execute it. The result is an undesired outright position. Traders often refer to this as being "hung" on a leg, or refer to it as "hang risk". However, thanks to advances in trading technology and the development of spread functionality in front-end execution systems, traders seldom manually put on or take off spread trades one leg at a time. The spread trading functionality allows traders to mitigate legging risk. To help avoid the problem of delayed entry into a second leg - or missing the leg altogether in extreme cases - many traders spend a great deal of time developing "pay-up tick logic" to help them work both orders in a market. A "pay up tick" means that a trader (or a trading system) agrees to pay up to a certain price for the second leg of a spread. The idea is the trader would rather have the complete spread at a slightly worse price than chase the second leg up to a higher price level-or miss the second leg, as is the case during economic releases or other volatile situations. Every spread carries with it different dynamics that affect the way a spread will act during major economic releases. These different dynamics can increase the chance of legging risk. So some traders will back away from these volatile events, while others view them as a chance for price discovery. Traders should work the more illiquid side of the spread first, since this leg presents the greatest legging risk. In the case of an FESX/FDAX spread, the FDAX leg is typically the more illiquid leg and so should be executed first. The FESX is a more liquid contract and the likelihood that the leg will be filled is higher because of the greater market depth. Most auto spreading programs allow user defined and custom strategies to work both sides of the market. Once the less liquid leg of the spread is executed, auto spreading programs will cover the other side of the spread based on the user-defined instructions mentioned above. Later we will get to certain risks with automated systems. Benefits of Spread Trading Spreading provides a means for traders to potentially make money whether the overall market is rising or falling, as long as the spread relationship moves in the "right" direction. The relationship between two legs of a spread - not the absolute price of the index futures - determines whether a trade is profitable, as the example above shows. If a trader feels, for instance, the German economy will underperform the European economy, overall market direction becomes irrelevant. In other words, spreading removes one element of a complex trading equation-the overall market direction. There are many potential rewards to spread trading. For example, traders have the ability to dampen volatility, track money flows and identify relative strength relationships between two or more investment vehicles. Moreover, having to decide which components of the market are over- or underperforming better fits some traders’ styles than having to speculate on the outright direction of the market. When traders create synthetic relationships to trade, it can give them a sharpened perspective to analyze market behavior. While past performance is never a guarantee of future results, some spreads show a greater respect for technical or algorithmic criteria than the underlying market. As a result, the ability to find trading opportunities may be greater. An additional benefit of spread trading is reduced margin requirements, also known as spread margin, because positions are viewed by exchange clearing houses as partially hedged (the long position partially offsets the short position). Identifying a Spread to Trade As the first step, the trader has to identify a spread that suits his trading needs. There are a number of factors to consider when deciding which spreads to trade. The important factors are liquidity, key trading hours, knowing the components of the underlying index, and the correlation between the products in the spread. Liquidity is a major factor in determining the effectiveness of a strategy and becomes even more important as multiple legs are added to build a position. You need the ability to get in and out of positions at a desired price. Being in markets like the FESX, in which daily volume averages between one and two million contracts, helps reduce slippage (the difference between estimated and actual transaction costs). As with any trading strategy, being familiar with trading hours is essential, since spreading two markets may depend on overlapping trading hours or times when greater or less liquidity is present. Illiquid hours may represent greater opportunity for certain strategies. When trading spreads, understanding the underlying components of the product is very important. In the case of the FESX/FDAX spread, you are dealing exclusively with European equity index markets, but there is a material difference in the components. You should stay apprised of potential news, as well as what components are influencing the underlying performance of one index over the other. Spread trading often takes on a certain arbitrage feel. The idea is that a correlation between two products that diverged will ultimately revert back to their historical mean. We know that this is not always the case. However, through the use of historical correlation it is possible to create a framework to assess future correlations of a spread. The goal is to use the deviation in historical correlation as a tool to play a possible reversion to the historical mean of the spread. Higher historical correlations can mean less risky spread trading strategies. Contract Size & Currency Conversions Once a spread has been identified, the next step is to determine contract size. The time frame used to evaluate a position can play a significant role in determining contract size. A common tool is average true range, which gives a sense of the natural range of a contract. This is a popular and often standard indicator found in many charting packages. When looking to trade the FESX/FDAX spread, the average true range of the FDAX market from June 23 to July 30 was approximately 117 points, while the average true range of the FESX was approximately 58 points. This can give you a good indication of average moves during a given trading day, which can be helpful in determining profit targets and stop-loss levels. Another important consideration is determining a spread ratio, or the number of contracts of each that you should trade as part of each leg. To determine this, multiply the daily range of the chosen products by their value per point. To continue with our example, the proper contract ratio to trade would be approximately five FESX contracts for every one FDAX contract (chart 2)
----------------------------------------------------------- Please note that I round the spread ratio when trading small sizes. However, if trading sizes increase, rounding may cause inaccuracies. Creating the Spread
When creating a spread strategy, you need to determine how many legs will be
involved in the spread. Dual factor spreads are between two investment products.
The FESX/FDAX spread is a dual factor spread.
Multi-factor spreads involve more than two legs and consist of what is known as
the Note that the normalization ratio for multi-factor spreads, understandably, becomes more complex as you add legs. In addition, integrating multiple international markets to the strategy adds currency risk. Combining Structure and Strategy Pricing anomalies and market dynamics give astute traders opportunities to profit. In this, spread trading is no different from other strategies. A large number of techniques used in single-leg trading can also be applied to a spread. Strategies such as mean reversion, trend following and support and resistance can all be applied to a wide range of the spreads. In addition, there are spread-specific strategies such as arbitrage, calendar spreads, interexchange and future-spot (i.e. foreign exchange, stock, physical, gold). However, structural issues when trading spreads may limit some of the strategies that are effective when trading a single product. These are related to the risks discussed above. This structural component can also have a substantial impact in understanding the theoretical P-and-L of a strategy versus what is achievable in the real world. For example, issues such as sending off a high number of cancel/replace orders may be a vital part of some spread trading strategies. However, such actions can cause excessive message warnings, thereby resulting in large "technology surcharges" from exchanges and rendering the strategy not viable due to the structure of the marketplace. Another issue is the theoretical price traded of a spread compared with the actual price. As most spread trading charting packages have to factor in both prices of the underlying products, there exists a chance that fills may not have happened at certain levels portrayed on the charts. Unlike trading of the underlying product, where an exact report of time and sales can give a systems tester a better idea of the liquidity at a price on the chart, synthetically created spread trade charts have limitations in this regard. As electronic spread trading relies on the use of advanced trading platforms, the first strategy worth examining is scalping, which requires speed. The metrics behind scalping a synthetic spread like that of the FESX/FDAX are challenging. The necessity to execute two or more legs in a spread makes it difficult to get simultaneously filled on the bid for the long leg and the offer for the short leg. This puts tremendous importance on proximity solutions and trading in a low-latency structure, which are part of most proprietary or quantitative trading firms. The legs needed to create a spread introduce extra transactional risk that one may not normally find when just scalping the outright product. There is an extra level of risk for the spreader who trades higher units of spreads- the sizing to achieve one unit of exposure is higher than if they were simply trading the underlying market. For example, looking to go long one unit of the FESX/FDAX spread would entail working a buy order of five contracts for the FESX while simultaneously working a sell order for one FDAX contract. If you are working an order to buy five units of the spread, you are working a 25 lot buy of the FESX and a five lot sell of the FDAX. Depending what pay-up tick logic is in place on the front end, the hang risk from such a position may leave you exposed to a long or short market view which is substantially higher than your trading account is structured to handle. Conclusion Despite the complexity and challenges, spreads are a valuable tool for reducing factors like market risk and volatility while increasing profits. I find this is the case in my strategy, which typically entails identifying bullish or bearish sentiment in the market and providing liquidity on the side of the prevailing sentiment. I couple that with cross-market correlation analysis, i.e. the relationship between equities, currencies, fixed income, energies, metals etc., which plays out nicely as a natural byproduct of executing spread trading strategies. A spread position of equity small-caps versus large-caps may give a better risk-adjusted return than just being long the FESX, as the first trade may better reflect the risk appetite in play. |

|
This article was published in Opalesque Futures Intelligence.
 

|


