Currently: Cash Looking to: Short @ 1,765.50
As of 3/21/21 @ 9:02pm EST: 1,738.90
LAST WEEK: We suggested covering shorts / getting long at 1,655 with stops on a close below 1,617 and with a target of 1,775 for selling longs / getting short. Stops on shorts were suggested on a close above 1,783 and we gave a target of 1,655.
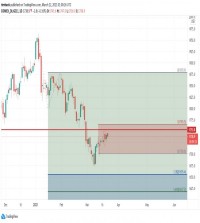
UPDATE: Technically it looks like gold may have strong resistance at either 1,753.8 or 1,765.5 in the very short-term and that it should trade down towards 1,655.4 or 1,617.30.
We would look to sell longs at 1,753.80 and get short at 1,765.50 and would look to cover shorts at 1,655.40. We would look to get long of gold on an extended dip to 1,617.30 with stops on a close below 1,613 and would look to take profits on longs at 1,765.


 RSS
RSS


