


 RSS
RSS|
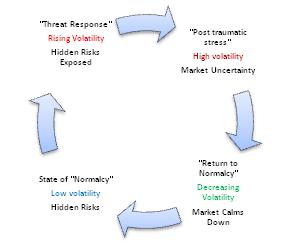
Managed Futures and Volatility: Introduction 2011 was a period fraught with turbulence in financial markets. Managed Futures strategies, despite their common association with long volatility, did not fare as well as some might have expected amidst this turbulence. A closer look at volatility, what it means to be long or short volatility, and Managed Futures performance across different regimes in volatility can provide insights into the strategy's complex or "convex" relationship with volatility. A closer look at the cycles of volatility demonstrates that Managed Futures is able to capture "crisis alpha" for investors over negative volatility cycles while in certain turbulent periods they also face some of the same "short volatility" risks that plague many hedge fund strategies. Defining Volatility, Links to Behavioral Finance Volatility is often used as a measure of the amount of uncertainty or level of risk in markets. In practice, volatility is estimated by using either the standard deviation of a sequence of returns or implied volatility in options contracts.1 As volatility rises uncertainty has entered the markets, when volatility goes down the level of uncertainty has gone down. Volatility is cyclic in nature just like the booms and busts of equity markets. The cyclical nature of volatility may be driven by different cycles of human behavior initiated by either positive or negative stimuli.2 Positive volatility cycles are driven by overconfidence, greed, and exuberance similar to a lucky gambler in a casino. Negative volatility cycles are driven by fear, anxiety, and distress. Negative volatility cycles are much longer and more drastic than positive volatility cycles. Volatility cycles are consistent with theories on human behavior which have widely documented the stark asymmetric impact of losing as opposed to winning. The bottom line is that we all hate to lose money and we actually hate losing money even more than making it. In the following sections, negative and positive volatility cycles are explained. Figure 1 presents a negative volatility cycle and Figure 2 explains positive volatility cycles and their connection to negative volatility cycles. In both cases the base case is a "state of normalcy" where volatility is low and market participants feel generally safe in markets. When markets are in a state of relative normalcy, risks may be hidden and investors may have a calm and possibly superficial sense of safety. Examples of these types of hidden risks include credit and liquidity risks. These types of hidden risks are under the surface and they tend to pop up unexpectedly having sometimes disastrous consequences on market value.
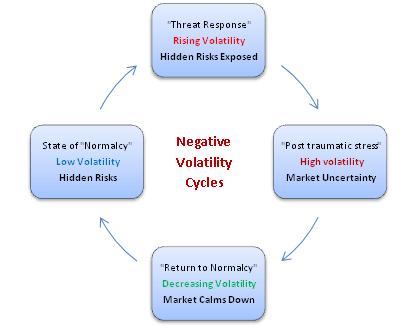
Figure 1: A Schematic of Negative Volatility Cycles Negative Volatility Cycles If something unexpected happens and it is bad, market participants perceive this as a threat and investors scrabble to deal with the situation while volatility rises. After the scrabble, investors are still shocked and stunned by their experiences leaving them in a state similar to post-traumatic stress where their appetite and preferences for risk differ greatly from prior to the "traumatic event". Just like individuals post trauma, market participants may perceive threats everywhere even if they may or may not exist. They may become overcome with fear and anxiety at much higher levels than usual. This period will be a period of high volatility and uncertainty in markets is drastically different than during a state of normalcy. Research on human behavior post stress is consistent with this pattern in markets. As the fear, slowly, eases away over time volatility or uncertainty in markets will begin to decline again in a "return to normalcy.3
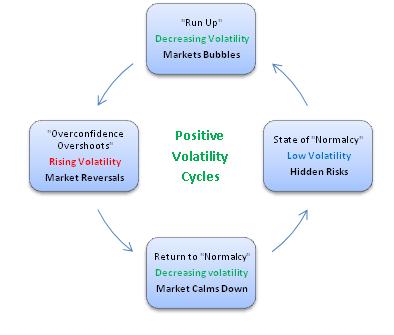
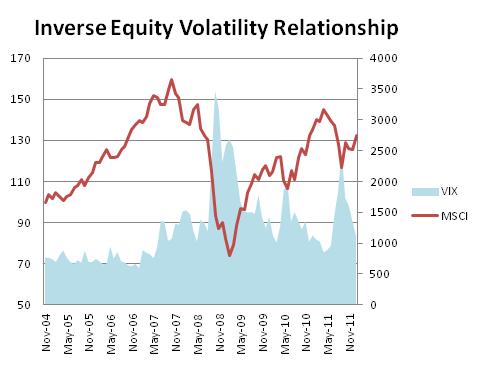
Figure 2: A Schematic for Positive and Negative Volatility Cycles and ConnectionsBetween Them Positive Volatility Cycles If something unexpected happens and it is positive, investors may tend to feel surges of exuberance resulting in overconfidence.� Biologists call this behavior the "winner's effect"where winning a perceived challenge results in increased levels of confidence (which may be due to surges in testosterone and testosterone cycles) which in turn leads to an increase in risk taking behavior in futures challenges.4 This change in investor behavior will cause a run-up in market values (similar to an asset bubble). The run-up is often followed by a successive reversal and corresponding surge in volatility due to large price changes and investors reaction to taking losses. In certain cases, but definitely not all, if the reversal is deep enough and the reversal can be perceived as a "threat", it may begin a new negative volatility cycle. Figure 2 demonstrates the path of a reversal (the dotted arrow) which breaks the positive cycle and jumps directly into a negative cycle. The run-up in equities up until the summer of 2011 and the subsequent reversal following is an example of a reversal which started a negative cycle in volatility because following that reversal hidden risks related to solvency of US government debt and political risk came to the forefront following this reversal. The Inverse Equity-Volatility Relationship Consistent with the concept of positive and negative volatility cycles, empirical evidence has shown that equity markets exhibit a net "short volatility" position. Since 1990, the correlation of equities with changes in volatility is roughly -60% but in the past few years that correlation has been closer to over -80%. Put simply, this means that equity markets tend to lose money when volatility or uncertainty increases or volatility tends to be high when equity markets take losses. Given the explanation of volatility cycles, equities losses represent a "threat" for investors which increases volatility and alters risk preferences going forward. Recent research on the inverse relationship between equity and volatility has shown that, despite previous theories regarding this effect, traditional fundamental factors may not be to blame for this relationship. Instead, the equity markets relationship with volatility may be caused by the fact that our risk preferences are conditional on past experience consistent with the concept of volatility cycles.5 In simple terms, following difficult periods in equity markets investors will alter their risk preferences since the memory of traumatic events like 2007-2008 are still vivid in their memories. The inverse equity-volatility relationship is apparent in the graph below. When equity markets take losses, volatility is up and vice versa.
Figure 3: The Inverse Equity-Volatility Relationship What does it mean to be classified as "long volatility" or "short volatility"? Despite the simple interpretation of volatility as a measurement of uncertainty, the classification of "long volatility" or "short volatility" is often relatively complex and loosely used to describe many different strategies. Strategies types can be divided into two groups: pure-play volatility strategies and convex (or concave) volatility strategies. Pure play strategies are rather straightforward yet convex (concave) volatility strategies tend to have complex relationships with volatility that may be hard to predict.
Given the rather broad definition of concave "short volatility" exposure and that fact that it impacts most hedge fund strategies, it is important to discuss "short volatility bias." Hedge fund strategies often use carefully calculated investment strategies. Many trade actively in their portfolios, employ leverage, take offsetting positions to hedge risks, and invest aggressively. Given this, when markets are stressed and there are extreme movements in prices their carefully chosen positions tend to be stressed as well. This stress results in margin calls from their brokers to cover positions and in some cases redemptions from investors, which may cause them to have trouble with collateral, or difficulty getting collateral from their prime brokers. Positions may have to be closed or adjusted at the wrong moment. The main point is that carefully constructed and implemented strategies with hedging and leverage may unravel in times of stress. This unraveling caused by spikes in volatility and short term turbulence in market prices will cause losses for these strategies. This bias to volatility is called a "short volatility bias" and strategies with this bias will tend to be concave "short volatility" strategies. In practice, the VIX Index is the most commonly cited source for measuring volatility since it represents volatility implied in moderately short term options contracts on the S&P500. Implied volatility is forward looking while historical volatility is backward looking. Implied volatility is the level of volatility that is implied in the prices for option contracts (contracts which are essentially prices for payoffs in extreme events) based on market participants' views today looking toward the future. Historical volatility is a snapshot of the past and past events not what markets expect for the future. Given the wide array of derivatives contracts, there are many ways to get a direct exposure to volatility. Commonly used contracts include volatility futures, volatility options, exotic options based on volatility, options, volatility swaps, variance swaps, etc. These contracts are often termed as giving you access to positive vega. Vega is a measure of the sensitivity of a contract to changes in volatility. Vega is a simple way of estimating how much your position will change if there is an increase in volatility. Given this terminology, equity positions have negative vega i.e. they will lose money than gain "on average" when volatility increases. This ends part one of the article.�The second installment discusses equity market crisis and negative volatility cycles in managed futures and much more. Biography Kathryn M. Kaminski, PhD, is the CIO and Founder of Alpha K Capital LLC, a thematic risk management fund focused on "offensive strategies" for tail risk management. Prior to starting Alpha K Capital, Kathryn worked in investment management as a Senior Investment Analyst at RPM, a fund of hedge funds in Managed Futures. While at RPM, she coined the phrase "crisis alpha" to describe Managed Futures strategies with her work in Futures Magazine and for the CME Education Group as a market commentator. She also has quant experience in both emerging fixed income and credit markets. Kathryn earned her PhD at the MIT Sloan School of Management where she did research on financial heuristics in collaboration with Professor Andrew W. Lo as part of the MIT Laboratory for Financial Engineering. Her research interests are in the area of portfolio management, asset allocation, financial heuristics, behavioral finance, and alternative investments. She holds and has held academic lecturing positions in the areas of derivatives, hedge funds, and financial management at the Stockholm School of Economics, the Swedish Royal Institute of Technology (KTH), and the MIT Sloan School of Management. Contact information: kkaminski@alphakcapital.com Selected References
Managed Futures Recent Negative Performance: It doesn't matter the managed futures index you follow, the fact is managed futures has not delivered stellar performance ever since the brilliant trends and market of price dislocation hit in 2008. For instance, the benchmark New Edge CTA index, which was down -4.25% in 2011 and is currently down -0.48% year to date.� The New Edge CTA index is similar in some respects to the Dow Jones Industrial Average in that it typically includes the largest and most significant CTAs.�This and other "large cap" indices are often a good proxy for managed futures because they show less survivorship and study bias than does the more general managed futures indices. With CTAs down -4.25% year to date and the S&P 500 Total Return Index up a strong 11.88% as of April, 2012, the question remains: is managed futures "broken?"� Should one exit their managed futures investments due to recent poor performance? The goal with managed futures is a diversifying component of a portfolio, the risk management balancer that provides different exposure.�� In other words, the trade off might look like giving up -4.25% in 2011 to gain the protection of +13.12% and +9.24% positive performance in 2008 and 2010 respectively, as was the case with the New Edge CTA index. Powerful market price trends, generated off the volatility of the 2008 credit crisis, have yet to emerge.� In fact, the trendless market environments of the past year have been more than challenging.� However, one need not be a follower of Elliot to believe that market cycles might tend to come in waves. �There are market environments of economic strength, price persistence, price dislocation and volatility. �The issue with managed futures is for these market environments to occur (trade "beta") and then for the individual CTA's algorithms (trade alpha) to properly recognize when to enter and exit the position. Knowing this is the key to recognizing why managed futures has not performed well over the previous years: the lack of price persistence, significant dislocation opportunities and volatility. Will this change?� That is for mathematical probability tables to predict, not a crystal ball to project.�It would be safe to say that at some point in the near future we might experience a degree of volatility that could bring about price persistence and dislocation opportunities. This highlights the point of managed futures: a foil to exposure to the stock market.�The idea is that during periods of stock market crisis, managed futures performs as planned and price persistence, dislocation and volatility all generate the appropriate market environment. To view managed futures performance and individual CTA analysis, click follow this link. 1. Mathematically, volatility can be measured by proxy using standard deviation. Standard deviation allows you to see how much something deviates from the average. 2. Research in empirical behavioral finance has demonstrated that different parts of the brain are involved in the coding of gains and losses. Differences in individuals' responses over losses and gains can be linked to actual financial decision making. See Knutson et al. 2011 and Knutson and Kuhnen 2005. 3. Coates, Gurnell, and Sarnyai (2010) and Coates and Herbert (2008) examine the role of steroids hormones and their role in financial risk taking using physiological data as well as performance data from real traders on a London trading floor. They show that testosterone is directly linked to return while cortisol (the stress hormone) is directly linked to uncertainty (as measured by implied volatility) and risk taking (variance in the P&L of market participants). Their research may help provide the link between economics and neuroscience. Cycles in hormone production have often been used by biologists to explain animal behavior in competitive settings.
4. The winner's effect is a cycle demonstrated in animals (and humans) where at the onset of a confrontation, testosterone increases, a challenge occurs and if the challenge is won testosterone increases causing heightened confidence and increased risk taking. See (Coates, Gurnell and Sarnyai 2010) for further discussion of their tests of the "winner effect". 5. In a recent working paper by Hasanhodzic and Lo (2010), they demonstrate that the "short" volatility relationship of equities cannot be shown to be due to leverage. Traditionally, the inverse relationship between equity markets and volatility was often attributed to Black's Leverage effect. This argument suggested that the de-levering of positions and the de-levering of company balance sheets was to blame for the increased volatility in markets. The basic idea of this concept is that as value goes down across markets the risk of financial distress increases because companies will have the same debt but less equity. This, in turn, would cause more uncertainty and risk of solvency making companies risker to invest in. In fact, in Hasanhodzic and Lo's conclusion, they point towards alternative theories to explain this relationship based on conditional risk taking behavior. 6. Beta expansion risk is the risk that a portfolio will suffer during down markets. This risk is seen in hedge fund strategies which may find their strategies experience problems when markets are in crisis due to difficulty in maintaining collateral and uncertainty in their trades. |

|
This article was published in Opalesque Futures Intelligence.
 

|


