


 RSS
RSS|

John McClure is the founder of ProfitScore Capital Management which develops and implements quantitative-based investment strategies. John formed formed ProfitScore in 1998; he has been involved in quantitative based research for over 25 years. Mr. McClure was an Independent Trustee for Northern Lights ETF Trust and President and Chairman of the National Association of Active Investment Managers. Mr. McClure holds a Bachelors Degree from Tennessee Technological University and a Masters in Business Administration from the University of Tennessee Chattanooga.
John McClure: The ProfitScore U.S. Treasury PLUS Program is a short-term systematic strategy that trades the long end of the yield curve, so with 10 plus years in duration. ProfitScore is a data-science based organization. We employ award-winning researchers, including PhDs and data scientists. Over half of our gross income is invested in R&D, so we are fully invested in improving our current processes and investing in our future. We run approximately $200m, $100m of that is invested in the Treasury Program. We are registered with the SEC and NFA. 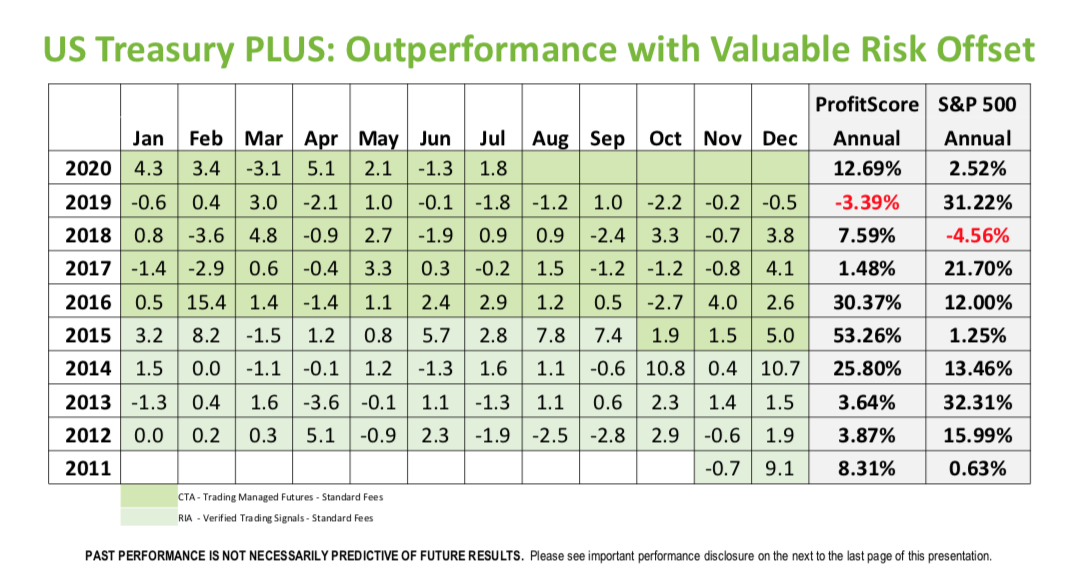
When you look at our numbers, you could consider this strategy a defensive strategy with a positive carry, as it is reflected in the monthly and annual number. If you were to focus in on the years where risk assets are under stress so Q1 in 2020, fourth quarter of 2018, 2016 and 2015 those kinds of years are our best performance. Therefore you could say that when risk assets are under pressure, we perform our best. Conversely, if you were to look at the years when equity markets are taking a moon shot like 2019, 2017 and 2013, we make a modest profit on average. But, most importantly. we are not a negative drag or negative carry on the risk assets in a portfolio. 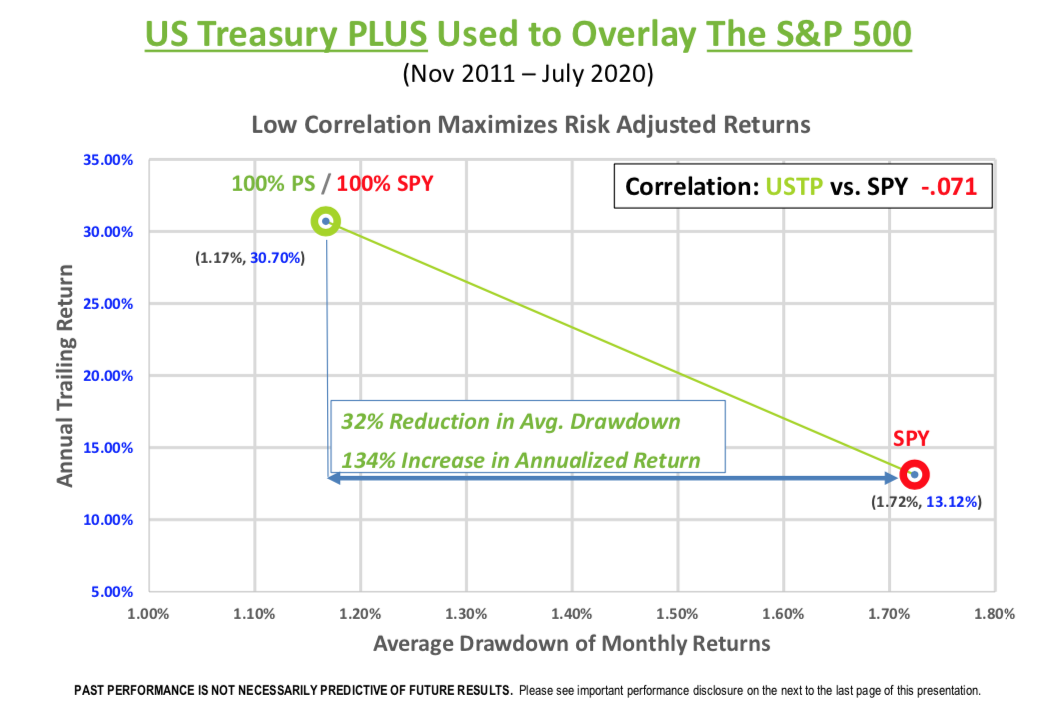
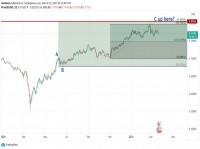
Here is another slide we like to show to offer some perspective of how this could be used in a portfolio because we see this strategy basically like a tool in an investors toolbox. Because of the capital efficiency of futures, you can use this strategy to overlay risk assets in portfolios. In this particular example, we have overlaid a static allocation to the S&P 500. Because of our low to negative correlation to risk assets, we are able to significantly improve the overall performance a little over 100% and reduce the drawdown of an allocation to the S&P 500 itself by a third at the same time. Matthias Knab: Can you give us a bit more detail how the strategy works? John McClure:Sure! We trade the long end of the curve, so 10 plus years in duration in a short-term systematic strategy. Our average trade length is approximately three days, so we dont need long- term trends to develop in order to be profitable. We also dont care if interest rates or yields are going up or down. When you crunch our numbers, one thing youll find is that we clearly have an informational edge: our hit rate is approximately 59%. In addition, our correlation is low to every asset class, every CTA, every hedge fund category that Im aware of. What this means is that where ever someone might put a strategy like this in your portfolio, its a great tool as an overlay in any allocation bucket, no matter if the investor puts us into a short-term bucket, a fixed income bucket or use us as a defensive strategy. Let me also point out that we provide complete transparency here at ProfitScore. There are no black boxes, and so when well do investor presentations these days more over the internet than in person I bring all members of my research team and we take you under the hood to show exactly how we make profits here at ProfitScore. Matthias Knab: How important are macro factors or the US Federal Reserve Bank for your strategy? John McClure:Thanks to the Federal Reserve and world reserve currency status, U.S. treasuries have a structural advantage over every other asset class in the world. In 1978, the Fed added full employment to its mandate. And since that time, when the U.S. economy gets under stress, the Fed steps in to stimulate the economy. They do that by lowering interest rates, possibly purchasing financial assets or by using other tools in their toolbox. The net effect is that treasuries get a bid. Now, most people are aware that this relationship exists, but almost no one is aware of just how powerful that relationship is. ProfitScores best IP, the best thing that we do, is our ability to be able to measure and capture the flight- to-quality movement onto the U.S. Treasury market. Let me show you what Im talking about. The blue line is the total return performance of 10-year treasuries, and the green line represents the performance of us trading 10-year treasuries but only during the flight- to-quality period. Youll see that for a period of time on the far left, theres flight-to-quality activity going on. Then theres no trading for an extended period of time, and then theres flight-to-quality and it goes flat again, and later flight-to-quality comes back in. But in the top right-hand corner, youll notice that the green line and the blue line end up in a about the same place. Now, this flight-to-quality movement only occurs approximately 20% of the time. But historically, it has produced 92% of all the performance into flight-to quality trading. Investors are usually looking to allocate to money managers that have an edge, and that edge shows up in their performance. At ProfitScore, you could say that our best edge is literally backed by the United States Federal Reserve. 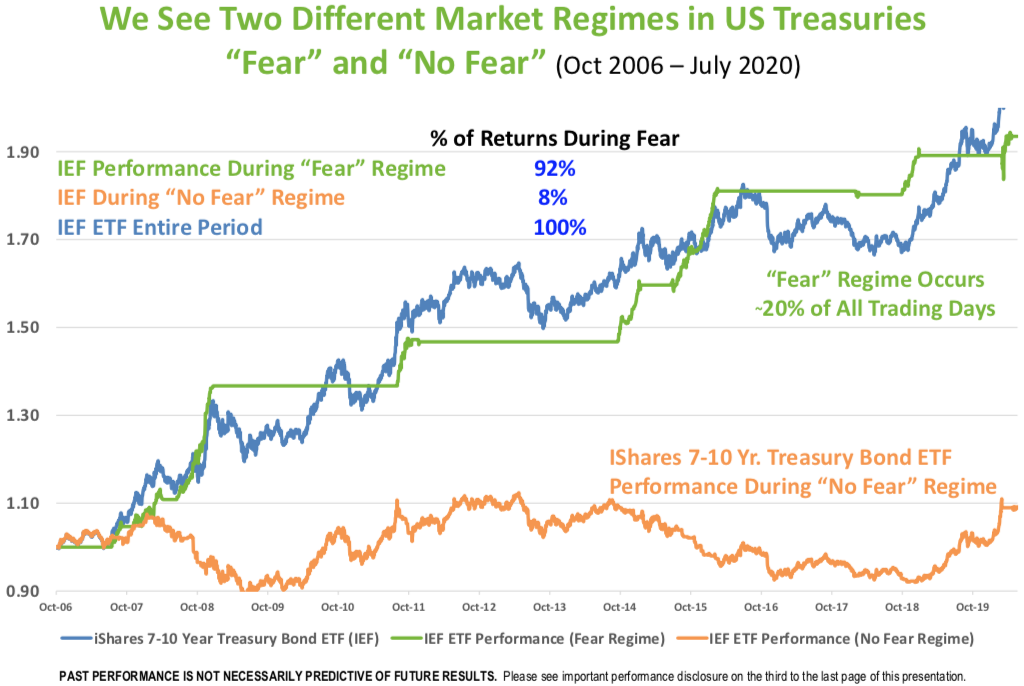
Now, to show you how further how extreme this example is, if you were to subtract out the green line performance from the blue line and stitch together the 80% of trades that are left or activity thats left in the 10-year treasury, thats the orange line down below. We trade both market environments, but we trade them completely differently. We actually look at the Treasury market as two completely separate asset classes that have to be traded completely differently. 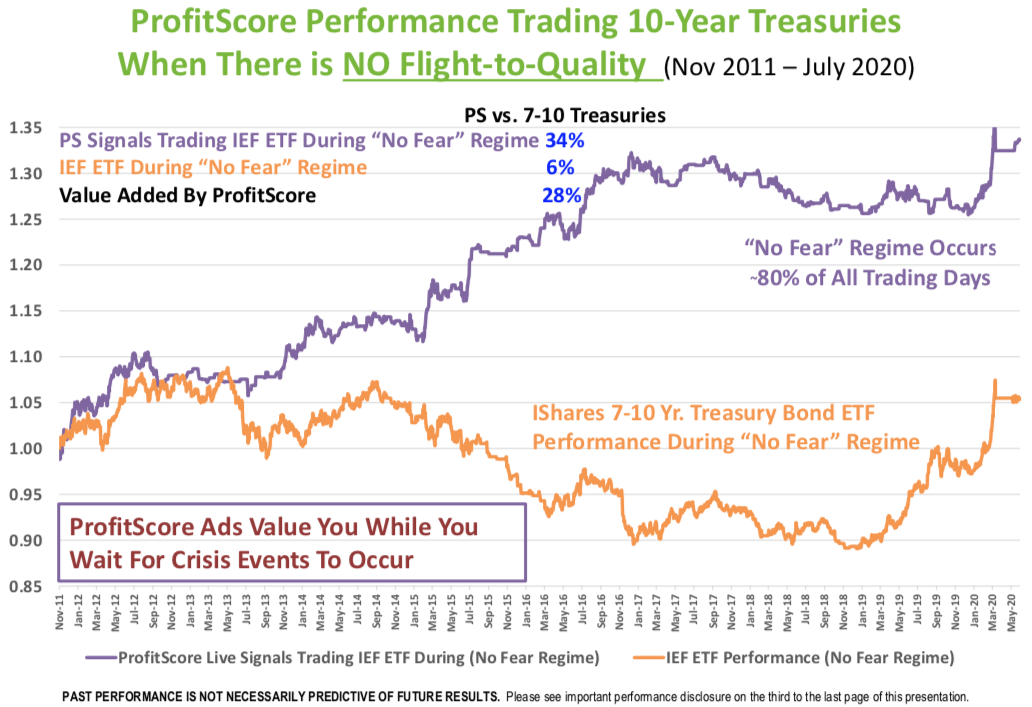
In this next slide, youll see what the non-flight-to- quality market looks like. Here you dont see this herd mentality or flight-to-quality thats going on. People own treasuries for a multitude of different reasons. The orange line is from the previous page and the purple line is our performance in this very difficult market. This is actually where positive carry comes from. We work really hard in this environment. We use different sources of information to capture the gains in this challenging market, and we add significant value above and beyond what somebody that possibly would hold treasuries in their portfolio would get. 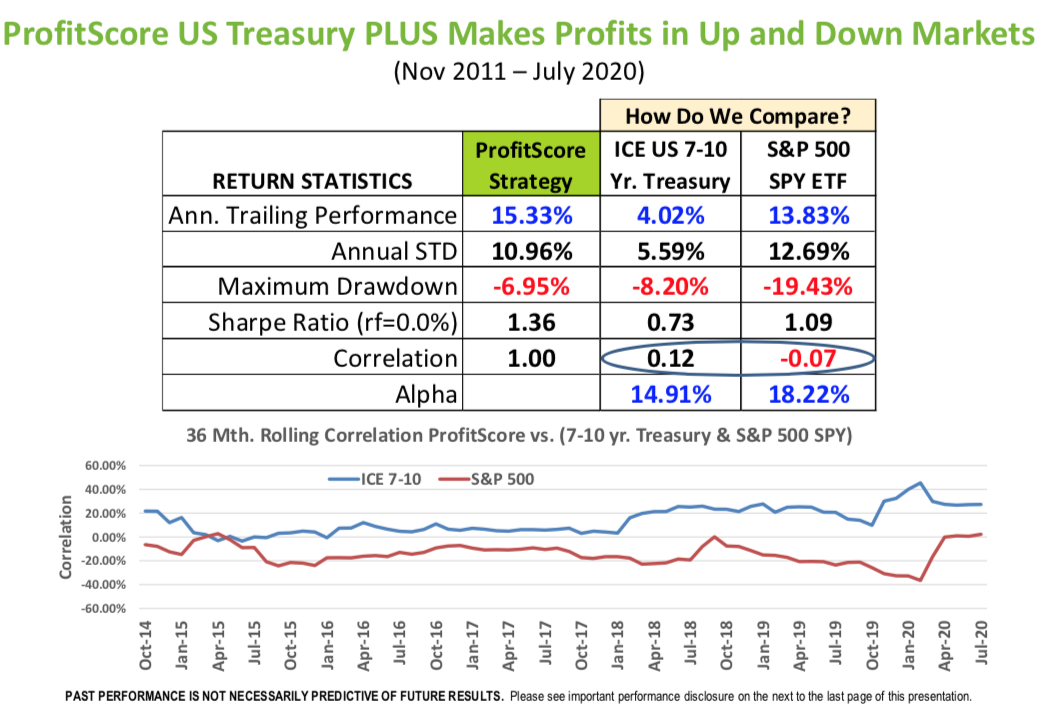
Here you see what happens when you bring both environments together in the same portfolio. Under the green label is our performance since weve been live compared to 10-year treasuries and the S&P 500. Ive circled in the correlation for the U.S. Treasuries and the S&P 500, so you see that we dont have a correlation to longer dated U.S. treasuries nor to the S&P 500. That has a lot to do with the short-term systematic framework in which we manage this asset class. At the bottom is a 36-month rolling correlation of those two asset classes. 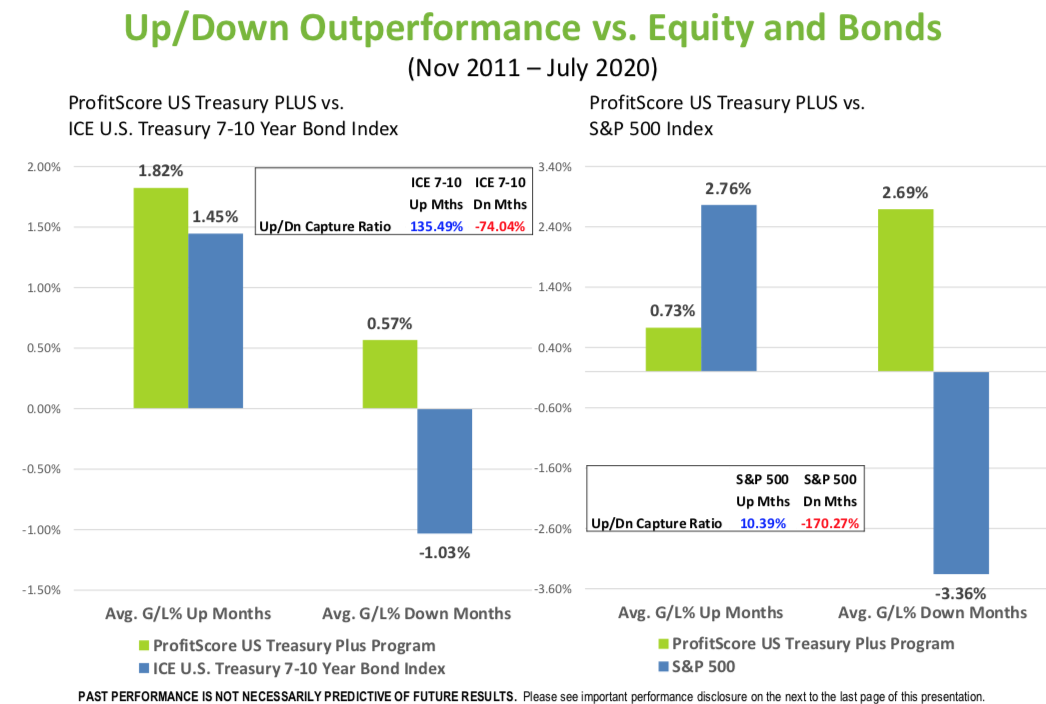
If I only had one slide to show you to explain how our performance works and where our value is at, this would be the slide. This is an upside-downside capture ratio. On the left half is 10-year treasuries and on the right is the S&P 500. When 10-year treasuries are up, we generally make a little bit more money. But importantly, when 10-year treasuries are down, we produce a positive result. This means that we have a significant downside negative capture ratio to longer data treasuries. And on the right half of the page, you can see that the S&P 500 is generally why people hire us because of how we function compared to long equity risk assets in a portfolio. When those risk assets are losing money, we have our best performance. But as importantly, when risk assets are making money, we are not a negative drag to the performance of your overall portfolio. 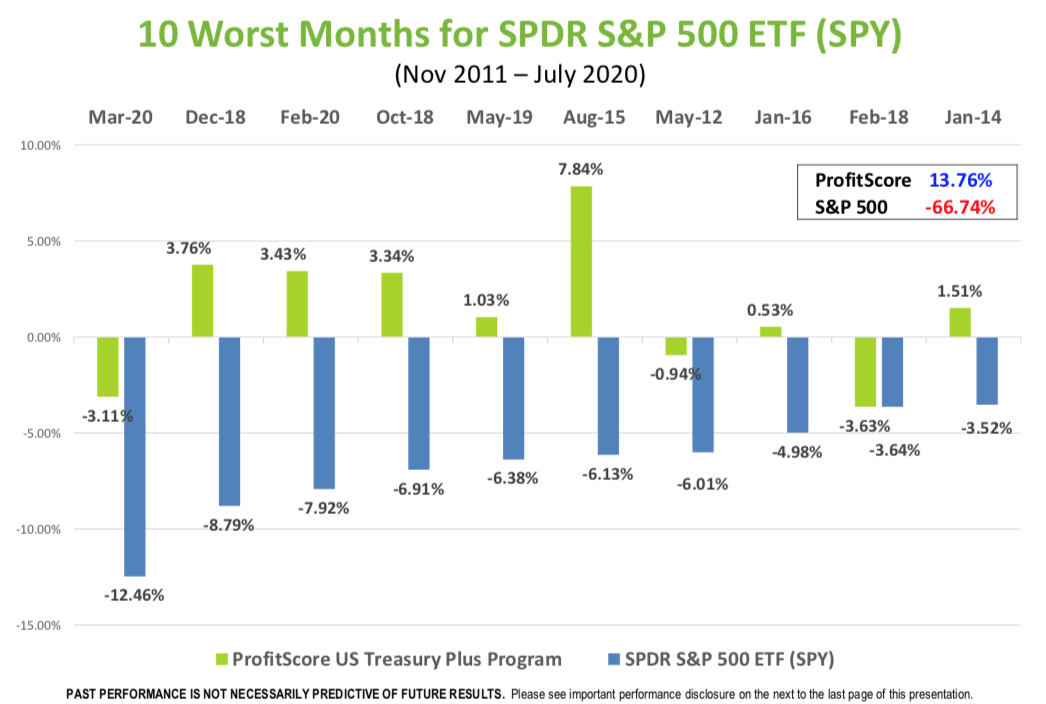
Here you see the worst 10 months of the S&P since we have been live in blue bars with the green bars representing our performance during those worst 10 months. When the S&P 500 is s losing money in those months, on a non-compounded basis the loss is approximately 66% while we made 13% during that environment. 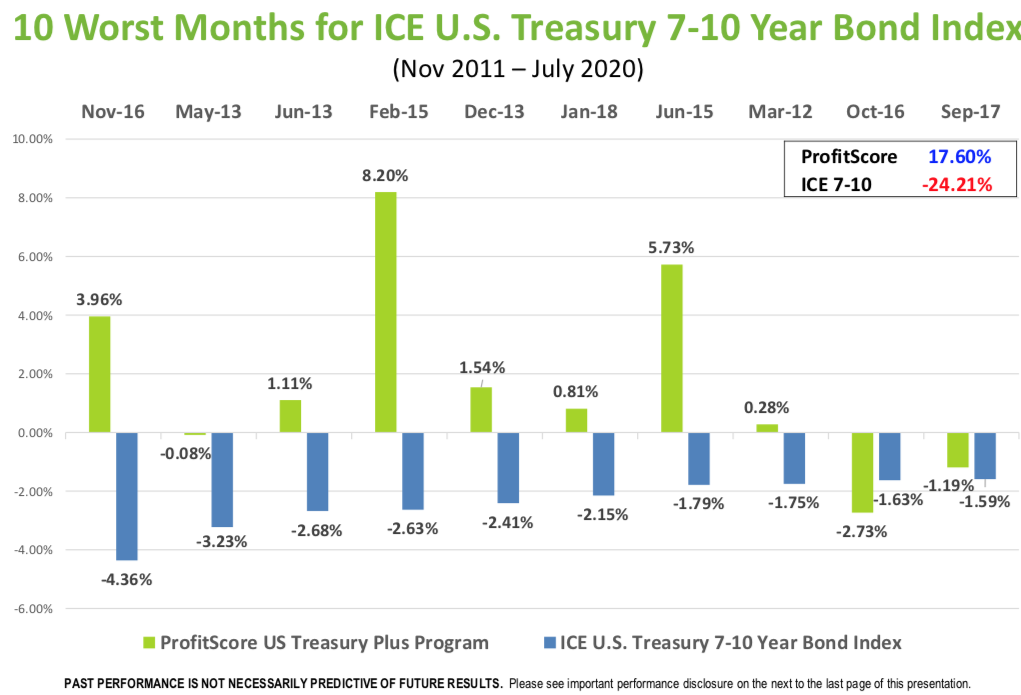
This is the same graph but different asset class. Blue bars here represent the worst 10 month in 10-year treasury since we have been live and the green again our performance during those worst 10 months. And once again, we produce a significant downside and negative capture ratio. Matthias, I could continue going through the list of benefits of this strategy and how it could be a tool in an investors toolbox. Let me put out a challenge to you or any interested accredited investor reading this. So I am challenging you because Ive done all the research, Ive compared our performance as it relates to other asset classes and as it relates to other hedge fund and CTA categories, and I know that we move portfolios higher in the Northwest quadrant.
John McClure was also speaking at a recent Opalesque FIXED INCOME REPLACEMENT Strategies webinar, you can watch his presentation in a video replay here https:// www.opalesque.com/webinar/#pw9 (scroll the video forward to 54:45 (min:sec). To contact John McClure and his team, email: managerinfo@opalesque.com. | ||||


|
Horizons: Family Office & Investor Magazine
Mastering the "Fear" and "No Fear" regimes means Profits in Up and Down Markets |
|


