|
|

Dr. Laurence Wormald
Volatility Forecasting
Risk management is in great demand but also more challenging in these turbulent
times. Indicators of future volatility are of particular interest. Here is a
discussion by Laurence Wormald of a well-established method for predicting
market volatility, as told to and written by Chidem Kurdas.
Dr. Wormald heads research at SunGard's Advanced Portfolio Technologies (APT), a
specialist in risk modeling. Before his current position, he was chief risk
officer at Deutsche Bank Global Markets. He has a master's degree in physics
from Cambridge and a Ph.D. in theoretical physics from the University of
California, Santa Cruz.
APT develops statistical market risk models and investment tools for a wide
range of asset classes, countries and regions. It has been supplying software
and services to investment managers since the late 1980s. Its founders came from
hedge fund and derivatives trading. SunGard acquired the business in 2008.
"Financial markets are a bit more complicated than the physical universe!"
There are times when people are not averse to risk and don't want to pay for
protection. Then there are times when people become very averse to risk and will
pay almost anything for protection. When you see a fire raging in the hills, you
suddenly think you should buy house insurance. But of course the insurance is a
lot cheaper when there is no fire raging. Risk models help traders and investors
avoid being the last ones to seek protection.
All our models are based on the same fundamental idea. Market data is very noisy
and the noise hides the underlying market drivers. We use a mathematical
technique, principal components analysis, to separate the signal from noise.
This tool for acquiring a signal from noisy data is well established and used
across many scientific disciplines. It is a very powerful methodology. But the
key issue is to apply it to the right macro data. You need to choose the right
set of data to find the signal.
We apply the technique to historical market data to establish the pattern of
covariance and volatility. The data typically goes back 180 weeks and includes
the price of every asset, from bonds, indexes and individual stocks in the S&P
to currency pairs, commodities and credit spreads. The risk factors that affect
all these markets are connected.
Our models generate forecasts for a couple of investment horizons-a short-term
horizon of three months and a medium-term implied horizon of one year. The
methodology is quite similar, but for different time frames we use different
weights in what is called the influence function. Thus in short term models we
place more weight on recent data. Giving more weight to last quarter's data in
the influence function skews the model's forecast to the short term.
Examples
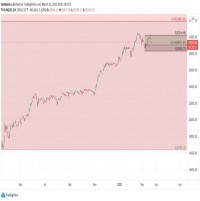
Looking back, our models gave reliable forecasts for the turbulent period from
2006 through 2009, very much in line with the way the VIX changed. When the VIX
fell from its peak of around 80 in 2008 to a low of 16, we thought is was
ridiculously low. It shot back up to 50 in the Greek debt crisis and is now back
to around 30.
We think volatilities will increase. Complacency appears to be over. For S&P 500
contracts we expect a little bit of easing in the short term but a year out
volatility will be back up (table). Volatility is on the rise for gold contracts
as well. But these numbers can change.
Forecast of Volatility
|
|
Three Months |
One Year |
|
S&P 500 Index Futures |
25% |
35% |
|
Gold Futures |
34% |
39% |
|
*as of July 22. |
|
|
In futures markets we look at different points along the curve and provide
estimates along the curve. For S&P and gold futures that means anywhere from one
day to five years.
If you need to know the risk in a basket of futures, what's important is
correlations, not just individual volatilities. Is there a positive, negative or
zero correlation between markets? The model forecasts average correlation over
three months. Correlation between S&P and gold contracts is negative. The three
month estimate is minus 35%, a year out the forecast is higher, about minus 40%.
Applications
There are different ways of using volatility and correlation forecasts. Some use
them purely as a risk management tool, for instance to stay within a given
volatility target. Others consider future volatility to determine how large a
bet to make.
These are not really tools for the intraday trader. Intraday volatility is
unpredictable. I don't think any model correctly predicted what happened in
August 2008. In four days there was a huge amount of volatility in the equity
market. Funnily enough, most traders would likely have avoided the big losses
they suffered if they had kept their positions. It was the impulse to try to
protect themselves by trading every day that led to big losses. You could not
predict the daily swings. By contrast, we think you can get meaningful measures
of volatility over a three-month horizon.
Another type of situation where this type of risk modeling does not work is when
there is no liquidity in the market. Collateralized debt obligations in
2008-2009 were not amenable to volatility forecasting. Futures markets, by
contrast, remained liquid. People who use our models trade in markets where
there is always some liquidity, so the theoretical underpinning of our model
continues to apply.
We are always reviewing the models and adding data. Markets provide much richer
data now than 25 years ago. Back then credit default swaps were not available so
we could not use credit spreads in the model as we do now. Another change is the
development of commodity trading in more places. As a result there is more
commodity data.
While the dataset has expanded, the risk modeling methodology has not changed,
because the fundamentals that drive market prices remain the same. Even crises
do not alter basic behavior.
We saw a lot of bad risk management during the crisis; many investors clearly
did not understand their risk. Financial markets are a bit more complicated than
the physical universe! Now everybody from public officials to heads of banks
demand better risk control. Using techniques like principal components analysis
can improve the practice of risk management.
|


 RSS
RSS


